
Economic update June 2024: a look at the Aussie jobs market
Key points
- The end of COVID saw an immediate surge in demand for workers in Australia, but border closures meant a reduced supply.
- Better balance is slowly being restored to the jobs market in Australia.
- There has been a strong increase in demand, notably in occupations associated with health and welfare spending, or sectors heavily impacted by COVID.
- There are now less job vacancies than pre-COVID for some IT occupations, as well as some consumer discretionary areas.
Where did all the workers go?
One of the great things about going to see clients is that you always get interesting questions. One question I’ve been getting asked recently is, 'Where did all the workers go over COVID?'
There is no doubt the worker shortage in recent times has been substantial. A 2022 survey saw a high number of employers nominating labour as a significant constraint to their profitability – the highest in 35 years. This is consistent with an unemployment rate that’s at its lowest level since the early 1970s.
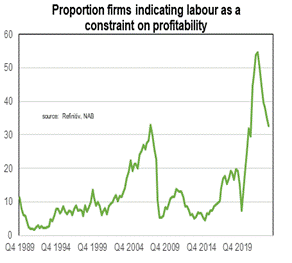
Labour shortages have been a major problem, although things are beginning to improve.
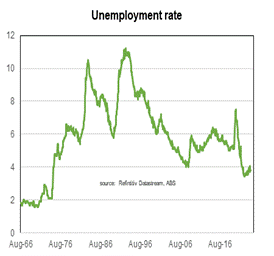
The unemployment rate hit its lowest level in 50 years recently.
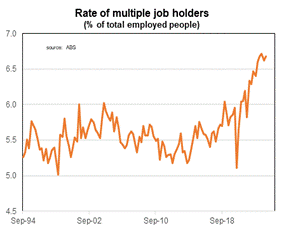
The number of workers doing more than one job in Australia has increased dramatically.
One factor behind the worker shortages was the shrinking of the labour force, principally driven by borders closing (and the exit of international students and other long-term visitors). Since then, the supply of workers has risen substantially, boosted by the large increase in immigration, but also the record participation rate, as well as the number of people working more than one job.
But the bigger problem was the sudden surge of demand as the economy opened post-COVID. It was always going to be impossible to meet such a fast swell, and inevitably caused supply-chain and worker shortage problems (as well as the rise of inflation). But demand in the economy has slowed with the decline of new orders, indicating there is further slowing to come.
Weaker demand is reducing the need for more workers – proven by the reduction in the number of vacancies and decline in the employment intentions of businesses. Workers have noticed the jobs market softening, causing concerns of unemployment to rise.
Australian consumer views as low as they were in the 90s recession.
The aggregate economic numbers hide performance differences across the economy. Consumers’ views of the state of their finances are currently as low as they were during the 1990s recession, which is unsurprising given the substantial hit to their disposable incomes after inflation. Interestingly, consumer views about the state of their own finances are significantly weaker than their view about the economic outlook.
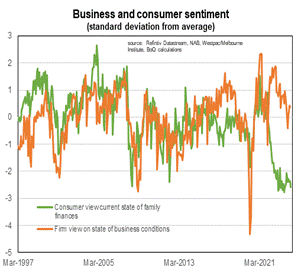
Aussie household sentiment has been substantially weaker than businesses, but the gap is narrowing.
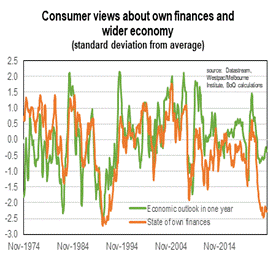
Aussie households view the state of the economy more positively than their own finances.
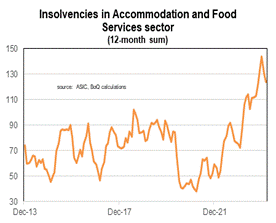
Insolvencies are on the rise in accommodation and food services, most likely due to a wane in spending habits.
While sentiment has notably declined over the past year, firms are more comfortable about the state of the economy, although conditions are mixed across companies. Businesses exposed to discretionary spending from consumers, or those that have been unable to pass on the significant cost increases of recent years (such as residential builders) have had a tougher time.
By contrast, the sectors more exposed to business capex spending, infrastructure projects, or government consumption spending (notably on health and welfare) are doing better. SMEs are feeling the pinch more than larger firms, as they are typically more exposed to the consumer.
he difference in performance between sectors is also illustrated by the changes in occupational vacancies. Since October 2019, the largest rise in job vacancies have either been in health (such as for doctors and nurses) and the NDIS (psychiatrists), or areas heavily impacted by COVID (air and land transport). Increased government spending has also seen more child-care vacancies. There has also been a notable rise in demand for teachers.
The most notable decline in vacancies have been in areas of IT, despite all the excitement about AI and investment into digitisation. Maybe the rise of interest rates has led to the slowing of Venture Capital investment into technology.
But it’s also likely a sign of firms keeping a beadier eye on costs. That is consistent with the decline of vacancies evident for some other occupations (such as HR, Sales reps and Personal assistants). The impact of weaker consumer discretionary spending is also evident in the declining need for bar attendants, cooks, hairdressers, and beauty therapists. We’re also seeing a weaker outlook for residential construction in the reduced need for architects and interior designers.
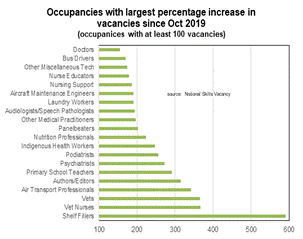
The need for certain occupations has sky-rocketed since the start of COVID. Data from Oct 2019 onwards.
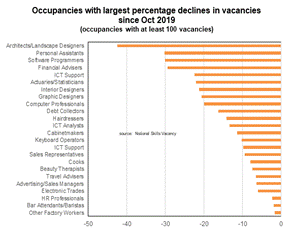
There has been a fall in demand for industries like design and IT. Data from Oct 2019 onwards.
What does this all mean?
The slowdown of the economy and larger labour force is seeing better balance restored to the jobs market. All those missing workers are now returning! The types of workers we need is changing. This partly reflects structural change in the economy (rising spending on health and welfare).
In coming years, we will need more workers in residential construction, the green energy sector, and defence. The lesson of recent times is that unless demand for workers slows in other sectors (or we can find more workers or boost productivity growth) then we may again find ourselves with ‘missing’ workers the next time demand picks up.
We really do live in interesting times.


