
Economic update July 2024: changing work dynamics post-pandemic
July Economic update key points
- Ongoing inflation data has increased the chances of a move in August.
- Whether the RBA does move will depend crucially upon the Q2 CPI data.
- At a minimum, the higher inflation numbers are increasing the chances that the first-rate reduction will be later in 2025.
- The growth in actual hours worked has been notably slower than for usual working hours.
- ·This largely reflects ongoing high levels of annual and sick leave that has been taken post-COVID.
May CPI results raise rate hike speculation
CPI outcome was higher than expected, making it the second poor monthly inflation read in a row. While monthly CPI data is not as comprehensive as the quarterly figures (the monthly outcomes haven’t always mapped well to the quarterly outcomes); if the June quarter is consistent with April and May, there’s a 50/50 chance the RBA will hike rates at their next meeting on 6 August.
The key will be the Q2 CPI data (released 31 July). At a minimum, the run of poor inflation data is increasing the chances that the first move down is unlikely to happen before mid-2025 (my current expectation is February 2025).
Economic shifts drive diverse job growth patterns across sectors
Aggregate jobs growth is strong, although divergent economic performance has greatly influenced where the jobs have been created:
- There has been robust employment growth in residential care, underpinned by strong government spending.
- The green energy transition has created demand for more workers.
- We’ve seen a big rise in building construction jobs.
By contrast, weak consumer spending has seen less demand for workers in the Accommodation and Retail sectors. Declining commodity prices has reduced demand for workers in some parts of mining such as Nickel. Narrow margins and slowing credit growth has led to reduced employment in banking.
Job growth outpaces hours worked, reflecting changing work dynamics
Jobs growth has been substantially stronger than the growth in hours worked, which also happened before the Global Financial Crisis (GFC). Another phenomenon we’re seeing in the market is the ratio of actual number of hours worked to usual hours is at its lowest level in over 20 years.
Usual hours can differ from actual hours as workers might be away for various reasons. During the pandemic, many worked fewer hours due to the lack of available work.
Now, with low unemployment and strong jobs growth, this is less common. However, more workers are reporting fewer hours because there is less work to do. This suggests a slowing job market, especially in sectors like Accommodation and Retail that rely on shift work.
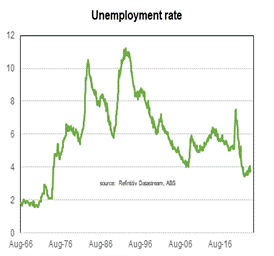
The Aussie unemployment rate remains low.
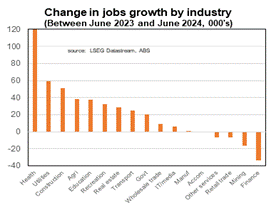
Aussie jobs growth has been strong in health and social welfare, but has declined in other sectors.
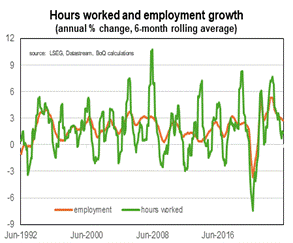
The growth in hours worked in Australian industries has slowed sharply, despite strong jobs growth.
Factors affecting hours worked post-pandemic
Weather impacts
Bad weather has been less of an issue over the past 12 months. Unlike in 2022 when NSW and Queensland were heavily impacted by flooding.
Job changes
In 2022, many workers changing jobs led to reduced hours worked. This is most likely due to time off in between roles (most workers don’t resign one day and start their new job the next). This was a response to the pandemic when fewer people wanted to switch jobs, although the strength of the labour market also played a role. Now, job changes have stabilised to historical averages.
Annual leave
There has been a large rise in the amount of annual leave taken. This is likely reflecting the swings-and-roundabouts of the low amount of leave taken during the pandemic. The amount of annual leave taken has started to decline and will likely fall further over the next year as excess leave is used up.
Sick leave
Sick leave also increased substantially after the economy reopened post-pandemic, due to increased social interaction, reduced immunity, and COVID becoming endemic. Although the amount of sick leave has fallen from its peak, it is still about 20 per cent higher than pre-pandemic levels, consistent with the high number of Google searches for 'flu'. It is possible that sick leave will decline as immunity to new viral strains develops, but there were several bad flu seasons in the years following the Spanish Flu (our last global pandemic) as the virus mutated.
There have also been a couple of longer-term trends driving slower growth in actual hours worked relative to usual working hours. One has been the trend rise in the amount of personal/care leave taken. There has also been a trend rise in the amount of maternity/paternity leave taken. This increase has come despite a decline in the number of births since 2017 (apart from the big spike in the middle of COVID).
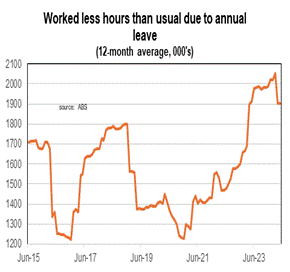
More annual leave is being taken now than in the last decade.
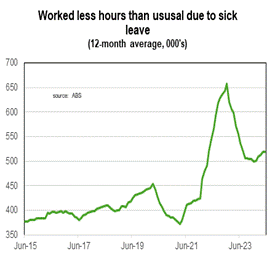
More sick leave is being taken now than in the last decade.
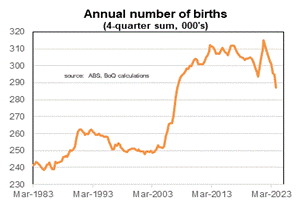
Aussie birth rates are seeing a slight reduction, after the COVID baby spike.
Implications of reduced working hours on domestic supply and inflation
The lower number of hours worked in the current economic cycle means that the domestic supply of goods and services is lower than usual. For goods, this lack of domestic supply can be offset by importing more. However, it is much harder to do this for services, which is why inflation in services remains high and difficult to control.
The main reason for the lower number of working hours has been the higher-than-normal rates of annual and sick leave. Normally, this would suggest that the number of hours worked will increase over the next year as excess leave is used up. However, other factors, like a weaker economy, may lead to reduced demand for workers and fewer hours worked. A key concern is how much this reduced demand will impact the unemployment rate.
We really do live in interesting times.


