Economic update: the global debt mountain got a little bit smaller
Summary:
- The global debt to GDP ratio has declined in recent years, mostly due to high inflation.
- That ratio declined in most OECD countries, although it has risen in some.
- Total debt to GDP in Australia is very low by OECD standards but the household debt ratio is high.
- Most countries have at least one sector of the economy with high debt.
The current Debt Ceiling debate in the US is a reminder of the problems a country can have if it has too much debt. Once a quarter an international industry banking association (the International Institute of Finance, or IIF) publishes data on global debt. Knowing how much debt is outstanding and who owes how what debt to whom is important to understanding potential economic and financial vulnerabilities.
There are limitations on focussing on the amount of debt outstanding:
- It is not the size of debt that matters but the ability of the borrower to repay debt. That is why the main benchmark used for sustainability is debt relative to the size of incomes (or in the case of countries, debt to GDP).
- Even then a simple debt to GDP ratio can be misleading as high-income countries are able to service a higher debt ratio than low-income earners.
- The other key variable for debt servicing is interest payments (and is why a ratio of interest payments to income is used). The ratio will be influenced by the amount of debt outstanding, the size of borrowers’ income and the level of interest rates.
- Another important question is whether debt is used to fund consumption or investment. Investment spending (hopefully) will lead to higher future income making it easier to repay debt.
- This leads to another important benchmark of debt relative to assets (and the quality of those assets).
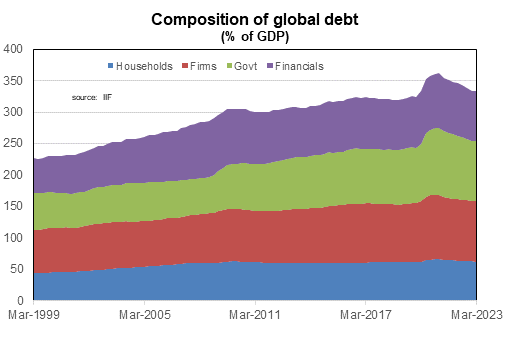
- Focussing upon total debt outstanding for an economy might disguise trends within sectors of the economy. The IIF details the debt outstanding for the four sectors of the economy (households, firms, governments and financials) relative to the total size of the country GDP; While that is a reasonable ratio to use for government comparisons (as governments can tax the wider economy) it is a little misleading otherwise as other sectors are only able to fund debt from their own sector income.
- The IIF details financial sector indebtedness, defined as loan and bond financing from financial markets. The measure chosen by the IIF excludes deposits which is another form of debt albeit one that is highly regulated.
Despite these limitations, examining debt to GDP ratios at an aggregate level provides a useful first screen for where potential economic or financial vulnerabilities to debt could reside.

The global debt ration has declined over the past couple of years, mainly due to higher inflation.

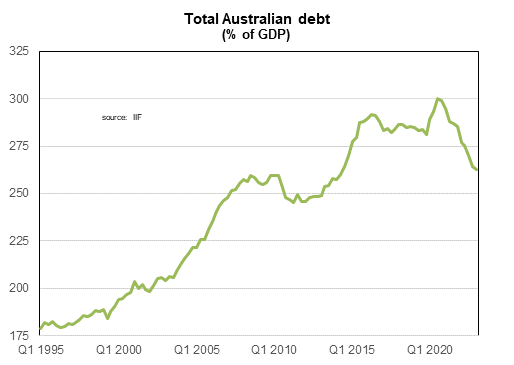
The total debt to GDP ratio in Australia is at its lowest level since 2014.
You can read my full update here.
We really do live in interesting times.
Regards,
Peter Munckton - Chief Economist.


