
Housing market update: July 2024
Key Points
- House price growth has been strong in the first half of 2024.
- Higher prices reflected strong housing demand, at a time of low new supply.
- Strongest growth at the lower end of the housing market in most capital cities shows us affordability is an issue.
- Decent house price growth is likely next year, although affordability concerns are likely to constrain the extent of the rise.
House price growth has been strong in the first half of 2024.
Dwelling price growth was up by a bit over 9 per cent in the year to June 2024. Apart from the COVID spike, growth in the first half of 2024 was at its fastest pace since 2010. Typically, this kind of growth occurs during rate cut cycles.
One exception was the pre-GFC period, when strong house price rises were underpinned by robust household disposable income growth. This time, it has been strong population growth at a time of sluggish new supply.
Strong house price growth is good for existing homeowners. But it creates affordability concerns for those that are still trying to crack the market. And affordability concerns are impacting the market. The strongest price growth over the past year has been at the lower-value end in all capital cities (with the exception of Darwin, the ‘most affordable’ capital city).
In Brisbane, Adelaide and Perth prices have been strong across dwelling types, with flat-to-modest growth in Melbourne, Hobart and Darwin. Growth in standalone house prices continues to be strong in Sydney, with movement more modest in unit prices. After a period of sluggishness, standalone house price growth has picked up in Canberra.
| City | Houses | Units | Regional | Houses | Units |
| Sydney | 10% | 5% | NSW | 5% | 2% |
| Melbourne | 3% | 1% | VIC | 0 | -1% |
| Brisbane | 16% | 20% | QLD | 11% | 13% |
| Adelaide | 16% | 18% | SA | 14% | 7% |
| Perth | 27% | 25% | WA | 19% | 9% |
| Hobart | -1% | 2% | TAS | 1% | 1% |
| Darwin | 1% | 1% | NT | -6% | -5% |
| Canberra | 5% | -2% |
Looking long-term: household performance
The topic of housing affordability has (again) become prominent. Most of the analysis is done by historical comparison (eg, comparing the history of domestic house price growth with indicators such as household incomes). But international comparisons (such as by Demographia) illustrate that not only have house prices in Australia risen by substantially more than household incomes over the past three decades but that ratio has risen faster in Australia than in peer economies.
Why have house prices jumped by so much more in Australia? Strong demand is a key factor, with Australia having the strongest population growth in the OECD over the past three decades. This has been exacerbated by Australia having one of the highest concentrations of population in major cities in the OECD. More recently this demand has been boosted by a decline in the number of people per household (most notably in Sydney and Melbourne).
Moreover, our demand for land in the major capital cities has been boosted by Australia having near the highest proportion of standalone housing in the dwelling stock (according to the OECD New Zealand has a larger proportion).
And Australia’s houses are the largest in the world. Indeed, if you measure it on a square metre basis Australia’s house prices don’t look expensive. They are around the same level as most wealthy Northern European countries and are significantly cheaper than in wealthy Asian economies with densely populated cities (such as Hong Kong, Japan and South Korea).
The US stands out for having cheap housing (although it is very expensive in some cities such as New York and San Francisco).
Increasing affordability concerns are having implications
The increasing affordability concerns are having implications. One is a decline in the home ownership rate (mainly amongst lower-income earners). Another is that the fastest areas of population growth in Australia are outside the major capital cities. Partly that reflects the impact of an aging population (as retirees move to areas such as Hervey Bay and Sunshine/Gold Coast). It also reflects the ongoing strength of the mining industry (Karratha). But it also is a result of households moving to regions where cheaper housing is available near the largest capital cities (Logan, Bunbury, as well as regions around Sydney and Melbourne).
The rising cost of land has led to units becoming an increasing proportion of the housing stock. Such a significant change in the type of dwelling also has wider implications (changing ‘look’ of neighbourhoods, greater density means increased demand for local infrastructure that governments have struggled to meet). The result has been political resistance to the growth of new forms of housing (evident in the approvals process from local councils).
The increase in both the cost of land and construction has also seen the size of houses start to decline in the two most populous cities (Sydney and Melbourne). In time that trend will also likely occur in the other major capital cities.
There have also been other factors limiting supply in this cycle. The big rise in costs over recent years has led to a decline in the number of construction companies (notably smaller firms). The need to build more homes is happening at the same time as there has been a significant jump in the amount of engineering and non-residential construction activity. The result has been shortages of skilled construction workers (and increase in labour costs) that has particularly impacted unit construction.
In time, there will be some improvement in the supply-demand imbalance. Some easing in cost growth of materials and the ongoing rise in dwelling prices will see housing construction become more profitable and see more builders return to the industry.
On the demand side, population growth has peaked and is projected to slow further in coming years. That should help with the demand-supply imbalance in the long-term but won’t help in fixing the housing shortage over the next 2-5 years. An increase in the number of people per household could help driven by the large increase in rents.
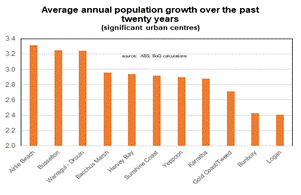
The fastest growing population areas are increasingly outside major capital cities.
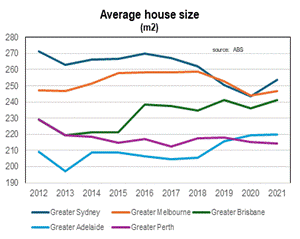
The size of houses has started to decline in the most populous cities
Forecast for standalone house prices for 2024 and for 2025
I have moved up my house price forecast for 2024. Partly that reflects the strength in the market of the first half of the year. But it is also an acknowledgement that the demand-supply factors that are currently impacting the market are unlikely to be resolved quickly.
Affordability concerns though constrain how much house prices can rise in most regions in the near term. Interest rate cuts would improve affordability. But the risk is that house prices would head higher and the improvement in affordability would prove to be temporary.
There were signs in the second quarter of a pickup in growth in the smaller capital cities (notably Canberra and Darwin), something that I expect to continue into the second half of this year and into 2025. I have revised up my outlook for Brisbane, Perth and Adelaide prices for the remainder of 2024 although I suspect the payback will be a slower pace of growth next year reflecting increasing unaffordability. For the same reasons I am expecting slower house price growth in Sydney next year.
The biggest surprise to me (maybe not to others), has been the ongoing weakness of Melbourne house prices. That is consistent with the anecdotes around the impact of higher property taxes. At some point though, affordability and ongoing strong population growth should lead to a relatively stronger increase in Melbourne house prices.
| City | 2023 (a) | 2024 (f) | 2025 (f) |
|---|---|---|---|
| Australia | 7 | 9 | 6 |
| Sydney | 13 | 8 | 4 |
| Melbourne | 4 | 2 | 5 |
| Brisbane | 12 | 13 | 6 |
| Adelaide | 9 | 13 | 6 |
| Perth | 20 | 22 | 7 |
| Hobart | -3 | 1 | 4 |
| Darwin | -1 | 7 | 8 |
| Canberra | 1 | 6 | 6 |
We really do live in interesting times.