Housing market update: October 2024
Key points
- Annual house price growth slowed, but income growth hasn’t caught up.
- A better balance between demand and supply is slowly taking place across Australia.
- Some further moderation in house price growth is likely in 2025.
House prices slowed down, but income growth still can’t catch up
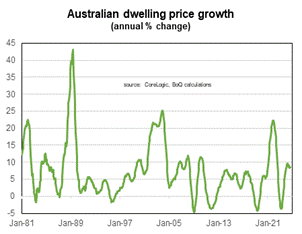
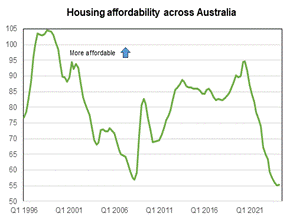
Annual house price growth across Australia eased a little in September, but it’s still above the pace of disposable income growth and its 20-year average growth rate. This continues to put stress on housing affordability, indicated by the elevated level of loan repayments relative to income, the outperformance of lower-priced housing, and the low level of buyer sentiment.

Dwelling prices have risen strongly over the past year although the pace of growth has begun to slow.

Australia's housing affordability is at its worst in at least 30 years.
A look at house prices across the major cities
The pattern of house price growth across regions in the first half of the year extended into the September quarter. Capital city house prices generally rose faster than the regions, and standalone houses grew more than other housing types.
Perth was the standout city, and we saw very strong growth in Brisbane and Adelaide. There was decent (but slowing) standalone house price growth in Sydney, with the increase in unit prices more modest. Price growth was only moderate in Melbourne, Hobart, Canberra and Darwin.
In the regions, there was strong growth in Queensland and Western Australia, and South Australia saw growth for standalone houses. Regional Victoria saw negligible growth, and there was negative growth in the Northern Territory.
| City | Houses | Units | Regional | Houses | Units |
|---|---|---|---|---|---|
| Sydney | 7 | 4 | NSW | 5 | 4 |
| Melbourne | -2 | 0 | VIC | 0 | -1 |
| Brisbane | 14 | 22 | QLD | 13 | 14 |
| Adelaide | 15 | 21 | SA | 13 | 0 |
| Perth | 27 | 29 | WA | 19 | 13 |
| Hobart | -1 | 3 | TAS | 3 | 3 |
| Darwin | 4 | -4 | NT | -6 | -9 |
| Canberra | 3 | -1 |
Source: Corelogic, BOQ calculations
Demand and supply directly impacted by construction and population growth
House price movements reflect supply-demand dynamics within each region. One way to gauge the demand-supply balance is to compare the number of homes being built with the growth of the population.
The average number of people per household in Australian cities is around 2.5. So, if the ratio of population growth to houses built is more than this, it suggests there aren’t enough homes for the growing population.
A shortfall in building may not necessarily lead to an immediate jump in rent and house prices. That will depend on how much of the existing stock of housing is vacant. But, if the ratio stays above 2.5 for long enough, then rent and house prices will likely rise – which would lead to an increase in the number of people per household, reducing the demand for housing.
Since the start of the pandemic that ratio has been above 2.5 in every state. In all states except NSW, that ratio reached its highest level in 40 years (where the data begins).
Population growth is slowing, slowly
The ratio is starting to decline across regions, although it remains at a high level in the four most populous states (particularly in Western Australia and Queensland). The ratio is closer to balance in South Australia and under 2.5 in Tasmania (a factor behind the slower house price growth in that state over the past year).
The balance between demand and supply should improve across all states. Population growth is slowing across all regions, most notably in Tasmania. However, population growth in the five largest states in this year’s March quarter was still high by historical standards.
Supply of standalone houses is on an upswing
There are also (some) better signs on the supply side. While approvals have been on a downtrend across regions over the past couple of years, they are starting to pick up for standalone houses in most states, most markedly in WA.
This uptick reflects the strong increase in standalone house prices that makes the building of new supply profitable. By contrast, approvals for other forms of housing (particularly units) are still falling. The construction of large unit complexes is now competing for people and materials with large scale government infrastructure projects. The demand for units has not been as high, which sees costs increasing by more than the rise of unit prices, making new construction less attractive.
The forecast for standalone house prices in 2025 is looking positive
Next year, the housing market should get support from an interest rate reduction, rising ‘real’ household disposable incomes (after inflation), and the ongoing mismatch between demand and supply (although that gap will continue to narrow). The negative factor will be the low level of affordability.
| City | 2023 (a) | 2024 (f) | 2025 (f) | 2026 (f) |
|---|---|---|---|---|
| Sydney | 13 | 9 | 6 | 6 |
| Melbourne | 4 | -3 | 2 | 7 |
| Brisbane | 12 | 11 | 5 | 3 |
| Adelaide | 9 | 16 | 7 | 4 |
| Perth | 19 | 23 | 12 | 5 |
| Hobart | -1 | 2 | 4 | 8 |
| Darwin | -1 | 5 | 7 | 8 |
| Canberra | 0 | 1 | 4 | 7 |
| Australia (avg) | 7 | 9 | 6 | 5 |
Note: Numbers are for standalone houses and are annual % change end December. Forecasts are based upon CoreLogic house price data. Forecasts are by BoQ Economics.
Peter’s predictions for the year ahead
In 2025, we are likely to see notable slowing of growth in the three cities that experienced the largest price rises this year – Brisbane, Adelaide, and Perth.
It’s possible Perth will do better than the other two cities, as it appears less over-valued. By contrast, the cities that have underperformed in recent times – Melbourne, Hobart, Canberra, and Darwin – are likely to see stronger growth.
I suspect Melbourne may underperform in the stronger growth group next year, given the current sentiment. But at some stage, Melbourne property prices are likely to have a better run, as it appears relatively cheap against the other larger capital cities, and population growth remains strong.
We really do live in interesting times.


