Economic and Financial Market Update: The China Story
Summary:
• China is becoming the most important economy in the world;
• The Chinese economy is slowing;
• And the Trade dispute is only partly responsible;
• The success of the Chinese is probably the most important issue for the global economy over the next five years.
‘When the US sneezes the world catches a cold’
The above phrase has often been used to highlight the importance of the US to the global economy post the Second World War. The origin of the phrase is of dispute. Some say it originated from Metternich (a famous 19th century German politician) who originally used the phrase referring to the importance of France (the largest economy in the world in the 19th century).
These days it is China that is increasingly the most important country for the world economy. The US economy is still the largest. But the Chinese economy is catching fast. Already China is the world’s biggest exporter, and is the number one provider of global travellers. Developments in Washington and New York still have the biggest impact on global financial markets. But it is developments in Beijing and Shanghai that increasingly matter more for the global economy.
Proportion Of World GDP
(estimate for 2019)

Size Of Nominal Economy
($m)

The Chinese GDP numbers indicate an economy that has been slowing over the past couple of years. After recording around 6.5% growth in 2018, the IMF thinks China will grow by 6.2% this year and 6% next year. These numbers are well down from the double-figure growth rates regularly seen a decade ago. Much of that slowing reflected structural factors (the size of the Chinese labour force is declining). But the more recent slowing is suggestive of cyclical factors.
The momentum currently evident in the economy suggests that the IMF forecasts might be a little optimistic. The unemployment rate is not blaring any warning, being both still relatively low by global standards and declining a little over the past year. But the unemployment rate is only published annually. In any event there have been questions raised about the reliability of some of the key macroeconomic numbers published in China. Regardless, it is worth examining a wide range of indicators for any country to sense check how the economy is evolving.
China GDP Growth
(annual % change, real)

Unemployment Rate
(annual)

A number of surveys confirm the story from the GDP data that the economy was slowing from late 2017. The surveys indicate that economic conditions are (at least not yet) as bad in 2015 (the last time there was fears of a substantial economic slowing in China), let alone the GFC. But the surveys also highlight that the manufacturing sector is doing it tough, as it is in many other economies.
Macroeconomic Climate Index

Key Chinese Economic Surveys
(3 month average)

Clearly the trade dispute is having a negative impact. The value of Chinese imports has fallen this year. Exports have been flat. But how much of the slowing is due to the Trade dispute as opposed to a general slowing of the economy is difficult to ascertain. While the extent of the slowdown of imports is more significant than during the Asian crisis of the late 1990s, it is not (yet) as great as what occurred during the GFC or the 2015 growth scare. Slowing money growth is also suggestive of a weakening economy.
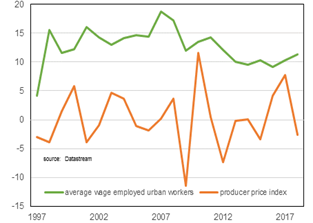
Another sign of a slowing economy is the decline of company profitability. Weaker domestic demand, softening global economy and the Trade dispute would all be playing a role. But Chinese firms are also facing margin pressure. Strong competition and a weaker economy is resulting in declining producer prices. At the same time wages growth remains strong (albeit down from its peak). And the weaker economy is not providing the same volume offset.
Exports & Imports
(12 month sum)

Industrial Company Profits

Average Wage & Producer Price Index
(annual % change, annual data)
Money Supply
(annual % change)

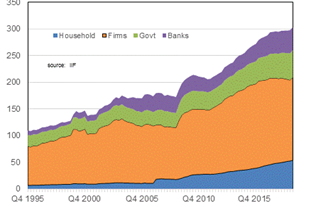
To protect the economy from the fallout of the GFC and European debt crisis the Chinese Government allowed a massive rise in debt (to fund infrastructure and other investment spending). That did help cushion the economy from the global slowdown. But such a large increase in debt in such a short period of time almost had to lead to some bad lending. The amount of debt currently outstanding in China is more typical of an economy where per capita incomes are twice as large.
A large part of the debt increase since the GFC has been by corporates. In more recent times there has been a significant jump in household debt (and to some extent government debt with fiscal policy being used to support the economy). The rise of household debt is even more marked when measured against the size of household incomes (the RBA calculated that the ratio increased from 43% in 2008 to 112% in 2017).
Wealth Of An Economy & Total Debt
(total debt % GDP v GDP per capita $US)

Composition Of Chinese Debt
(% of GDP)
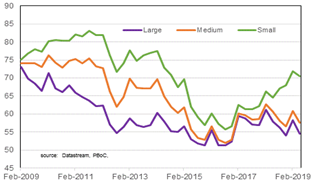
The Government has had success in slowing the growth of corporate debt. Feedback from bankers is that loan demand from medium- to large-firms is quite weak, the firms more likely to be more highly leveraged. Loan demand from smaller companies has been stronger in line with government encouragement that they should get greater access to finance. Concern about debt is the reason why there has been a decline in the ‘other investment’ category in the balance of payments (mainly Chinese banks’ lending money outside of China) over the past couple of years.
One of sectors feeling the crackdown on debt has been real estate where there has been a notable decline of business sentiment. Real estate development activity has been declining over the past year, but this did follow an extended period of very strong activity.
Loan Demand In China
(survey of bankers)
Real Estate Sentiment
(stand dev from average)

Other Investment Assets
(% of GDP)

Investment Real Estate Development
(annual % change)

Bad debts have been rising at Chinese banks, notably smaller ones (and rural). Smaller banks are less diversified, and are therefore more vulnerable if there are problems in the local economy. And some small banks profitability have been overly reliant on risky lending funded from the short-term wholesale market. One small bank has been taken over by the Government. Two others have received capital injections. At this stage bad debts do not appear to be an issue for the more systemically important larger banks. Chinese banks are also well capitalised and profitable.
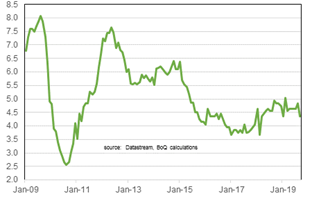
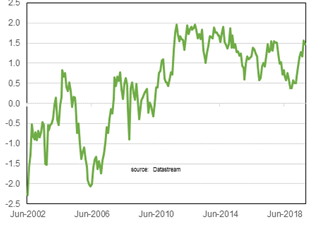
Despite the slowing economy the Government has allowed real lending rates to remain essentially flat over the past year. In a declining global rate environment this has resulted in Chinese Government bond yields approaching their highest level relative to US Government bond yields over the past twenty years. One reason the Government has not lowered interest rates is to keep on top of the bad debt problem. Another is to ensure that any decline in the exchange rate remains manageable.
Non-Performing Loan Ratios By Bank Type

Chinese Real Lending Rates
China-US 10 Year Yield Spread
(monthly)
Renminbi/$US Exchange Rate
(monthly)

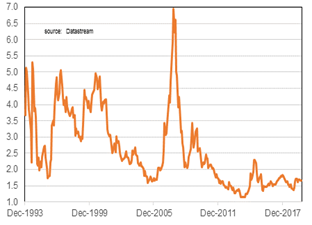
Financial markets appear to think that the Government is on top of any debt problems. Credit default swaps (a measure of credit risk for the Chinese Government debt) remain near their lows. In line with weaker profit growth and slowing economy, valuations in the Chinese stock market are low by pre-GFC standards.
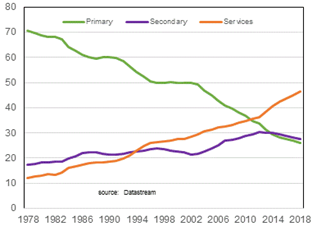
One reason for optimism is that the Chinese economy is becoming more consumer-orientated and service-sector focussed. A lot of focus has been on the weakening of secondary industries (manufacturing and construction). But over the past five years the proportion of the workforce employed in primary (agriculture and mining) and secondary industries has declined, but increased in the services sector. And surveys indicate that service-sector firms are currently more optimistic about economic developments.
Chinese Stock Market Price-To-Book Ratio
China Sovereign CDS

Proportion Of Employment By Industry
Household Consumption Selected Countries
(% of GDP)
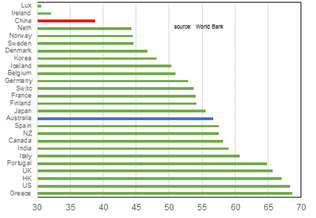
Consumption is starting to become a more important part of the Chinese economy. From around 35% of GDP in 2010, consumer spending is now responsible for a bit under 40% of GDP. This is still low by OECD country standards. But the Chinese consumer is close to overtaking the US as the world’s biggest buyer. And this is despite the slowdown of retail sales growth this year. But growth in overall household consumption (in the cities) has not slowed by as much suggesting that consumers are directing a bigger share of their wallets (and purses) towards services. Growth in air travel remains strong, albeit slowing over the past couple of years. Consumer sentiment is robust.
Retail Sales
(annual % change)

Urban Per Capita Consumption

Airplane Passenger Movements
(annual % change, 3 month average)

Consumer Confidence
(st dev from average)

So the Chinese economy is slowing, but is not yet at problematic levels. Its current state is better than the ‘growth scare’ of 2015, let alone what was experienced during the GFC or Asian Crisis. The outlook for consumer spending is important. The Chinese Government does not want the economy to slow too much. But it needs to make sure economic growth is sustainable (ie, less debt, less pollution). Whether they are successful is probably the most important issue for the global economy.
We live in interesting times!
Peter Munckton - Chief Economist