
Economic update 2024: half-year analysis
Key points:
- GDP growth in the first half of the year has been broadly in line with expectations.
- The unemployment rate has been a little lower., while inflation has been a bit higher.
- This combination has changed the discussion about the cash rate outlook.
- Right now, I am sticking with my view the next move in the cash rate will be down, albeit not until next year.
- The Q2 CPI data (released 31 July) will be the important data point as to whether another cash rate is likely.
2024 has been in line with expectations so far.
We enter the second half of 2024 with the economic story broadly the same as it was at the start of the year. Economic growth is weak. The labour market is strong, but inflation is too high. The financial market narrative has flipped from ‘the next cash rate move is down’ to ‘the next move could be up’.
And that leads into the key economic questions for the second half of the year:
- Economic growth will almost certainly improve, but by how much?
- How much softer will the jobs market get?
- Will the extended period of sub-trend growth lead to a renewed decline of inflation, or will further cash rate hike(s) be necessary?
BOQ key economic forecasts |
||||||
|---|---|---|---|---|---|---|
| Q3 2024 | Q4 2024 | Q1 2025 | Q2 2025 | Q3 2025 | Q4 2025 | |
| GDP | 0.9% | 0.9% | 1.2% | 1.6% | 1.8% | 2% |
| Unemployment rate | 4.1% | 4.3% | 4.5% | 4.5% | 4.5% | 4.5% |
Headline inflation |
3.6% | 3% | 3% | 2.8% | 2.4% | 2.8% |
| cash rate | 4.35% | 4.35% | 4.1% | 3.85% | 3.85% | 3.85% |
GDP and CPI is annual % change. Unemployment rate is quarterly average. Cash rate is quarter end.
Economic growth – better days ahead.
The moderation of inflation, as well as the tax cuts and government subsidies will see a notable improvement in household real disposable incomes in the new financial year (partly offset by more mortgage holders rolling off very low fixed rate loans).
A fair chunk of the additional disposable income will be spent. How much is saved will be the critical factor in determining the strength of the economic recovery.
My view is that economic growth in the next two halves will be sequentially stronger. But stronger does not necessarily mean strong. Consumers will rebuild their saving rate. Residential construction will remain weak.
Business capex spending growth may also slow (firms are reporting weaker growth in new orders). The global economy looks like it is in for another sub-trend year.
But outside of improved momentum in household disposable income, there are other reasons to expect stronger GDP growth. Fiscal support is taking a step up. And there are plenty of areas demanding higher investment (e.g., the energy transition, a bigger defence sector and data centres).
Labour market – further slow decline to come.
Typically, the current pace of economic growth would have resulted in a substantially weaker jobs market. Why not this time? Partly the demand for workers is slowing from an unusually high level. Following a couple of years of not been able to find workers employers are reluctant to retrench them.
The sector with the strongest jobs growth (health and welfare) is less influenced by concerns about profitability. Finally, hours worked has been lower than usual reflecting higher-than-normal amount of annual and sick leave taken.
The sub-trend pace of economic growth should see the demand for workers moderate further in coming months. The starting point of an extremely strong jobs market will limit the near-term rise in the unemployment rate. I think that the unemployment rate will eventually rise to be around the mid-fours.
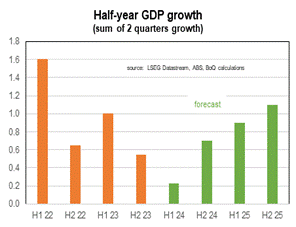
H1 2024 is likely to be the bottom of this economic cycle.
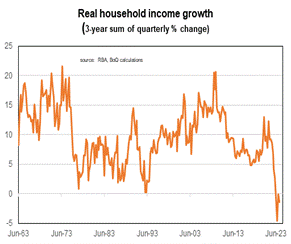
The weakness of real household disposable incomes has been the key economic driver over the past year.
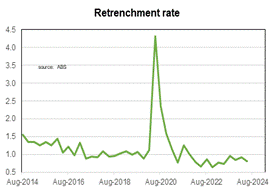
Australia-wide, the retrenchment rate remains low, and is lower than pre-COVID layoffs.
Inflation: the last mile is always the hardest.
The higher-than-expected inflation rate has mainly reflected developments in the services-sector. Higher supply and reduced demand have seen a slowing of goods inflation (it is now below service-sector inflation). But the level of goods prices remains elevated from the jump that took place during COVID, relative to the level of service prices.
For service-sector firms that means raising their prices to compensate for the higher cost of inputted goods (e.g., food in a restaurant, car parts for car insurance).
That gap between the level of goods and service prices has narrowed but remains about 5 per cent above its pre-COVID mark. Ideally, that gap would close more by very low goods prices growth. But the less goods price growth slows, the more the gap will be narrowed by service-sector inflation remaining uncomfortably high.
The other reason service-sector inflation has been high has been the increase in wages growth (the key cost for many service-sector firms). A key reason why wages growth has picked up is that workers have been looking for compensation for higher inflation.
There are signs that wage growth has peaked (particularly in the private sector). In their June Board minutes, the RBA raised the possibility that wage growth could be lower than their current forecasts.
The government subsidies mean the headline rate of inflation will get into the target band (temporarily) quicker. The RBA has made it clear they will look through this impact and concentrate more on the ‘underlying’ inflation rate (or the trimmed mean measure).
I think inflation will decline quicker than the RBA’s current projections as I have a lower economic growth outlook.
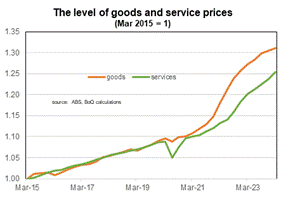
The level of goods prices remains elevated relative to service-sector prices.
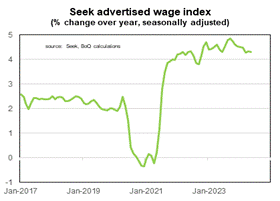
There are increasing signs that wages growth has peaked, particularly in the private sector.
The cash rate – the only near-term change can be up.
At the start of this year, I expected the next cash rate move would be down, but not until the end of 2024. The ongoing strength of the jobs market led me to push the timing of the first cut into the first half of 2025.
Some analysts looking for higher interest rates are doing so based on the view that the cash rate is lower than in most peer economies, and the current inflation rate is higher. But the higher inflation rate partly reflects that the Australian economy re-opened later than most peer economies.
And one reason for the lower interest rates is that growth in real household disposable incomes has been weaker and fiscal support is currently less generous than in peer economies.
A rate hike is not my central-case forecast. But recent RBA commentary means it has become a realistic possibility if inflation remains too high. If that does happen, it might be a ‘one-then-done’ rate change. But historically, rate changes are rarely orphans. At a minimum inflation and jobs market developments mean the possibility of a rate cut in 2024 has been dramatically reduced.
I have settled on February 2025 as my pick for the time of the first cut (with May a more likely scenario than any time in 2024).
We really do live in interesting times.

